Storytelling with Data was a surprise for me. Working on YASIV I often find myself testing it with the same test queries. I've been using "data visualization" as a test query for couple years, and the graph landscape didn't change too much.
Not until recently. The "Storytelling with Data" appeared on this search, and took top ranks on multiple scores:
- Popularity - this score shows how many other books list "Storytelling with Data" among their "Customers also bought" list.
- PageRank - this score shows probability that a reader will open "Storytelling with Data" if she randomly walks from one "also bought" book to another (assuming she only explores a graph below).
I'm currently half way through the book and deeply enjoy it. I'll let you decide whether you like this book or not yourself.
Today I just wanted to share YASIV's graph of this book, analyze major clusters and see if we can find any opportunities for new books. Let's go!
Here is a snapshot of "Storytelling with Data" book graph (April 2016):
As usual, a link between two products A → B means that customers who bought A also bought B.
→

While the graph above shows all product images, it is very hard to see existing clusters behind images. The "Storytelling with Data" describes this problem as a "lack of clear contrast". Let's fix it by temporary replacing product images with circles, and assign color for each cluster:
Now we can see clusters much better
What follows is my interpretation of major clusters.
Data Visualization
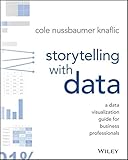
Storytelling with Data: A Data Visualization Guide for Business Professionals“Exploratory analysis is what you do to understand the data and figure out what might be noteworthy or interesting to highlight to others.”
“In general, those communicating with data need to take a more confident stance when it comes to making specific observations and recommendations based on their analysis.”
“Concentrate on the pearls, the information your audience needs to know.”
“What would a successful outcome look like? If you only had a limited amount of time or a single sentence to tell your audience what they need to know, what would you say?”
“It must articulate your unique point of view; It must convey what’s at stake; and It must be a complete sentence.”
Visualize This: The FlowingData Guide to Design, Visualization, and Statistics“Approach visualization as if you were telling a story. What kind of story are you trying to tell? Is it a report, or is it a novel? Do you want to convince people that action is necessary?”
“you should always be on the lookout for these two things whatever your graphic is for: patterns and relationships.”
“Data-checking and verification is one of the most important—if not the most important—part of graph design.”
“So it’s not just about the data that makes for interesting chatter. It’s how you present it and design it that can help people remember.”
“Think character development. Every data point has a story behind it in the same way that every character in a book has a past, present, and future. There are interactions and relationships between those data points. It’s up to you to find them. Of course, before expert storytellers write novels, they must first learn to construct sentences.”
The Truthful Art: Data, Charts, and Maps for Communication“The purpose of infographics and data visualizations is to enlighten people—not to entertain them, not to sell them products, services, or ideas, but to inform them”
“Good design isn’t about embellishment but about structuring information to enable understanding.”
“A data visualization is a display of data designed to enable analysis, exploration, and discovery”
“When you design a graphic to explain something, getting the information right comes first.”
“In candid communication, you begin with the information, and then you thoroughly analyze it to discover the messages worth spreading are”
Data Science for Business
Data Smart: Using Data Science to Transform Information into Insight“Data science is the transformation of data using mathematics and statistics into valuable insights, decisions, and products.”
“Cluster analysis is the practice of gathering up a bunch of objects and separating them into groups of similar objects.”
“If you define big data as turning transactional business data into decisions and insight using cutting-edge analytics (regardless of where that data is stored), then yes, this is a book about big data.”
“clustering is called exploratory data mining, because these clustering techniques help tease out relationships in large datasets that are too hard to identify with an eyeball.”
“Cluster analysis with k-means, as you'll soon see, is part math, part story-telling. But its intuitive simplicity is part of the attraction.”
Data Science for Business: What You Need to Know about Data Mining and Data-Analytic Thinking“Classification, regression, and causal modeling generally are solved with supervised methods. Similarity matching, link prediction, and data reduction could be either. Clustering, co-occurrence grouping, and profiling generally are unsupervised.”
“Extracting useful knowledge from data to solve business problems can be treated systematically by following a process with reasonably well-defined stages.”
“Formulating data mining solutions and evaluating the results involves thinking carefully about the context in which they will be used.”
“Data-driven decision-making (DDD) refers to the practice of basing decisions on the analysis of data, rather than purely on intuition.”
“data, and the capability to extract useful knowledge from data, should be regarded as key strategic assets.”
Doing Data Science: Straight Talk from the Frontline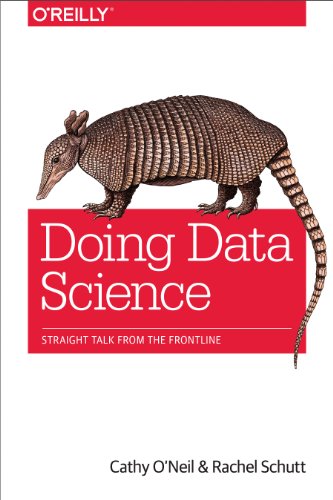
“statistical inference is the discipline that concerns itself with the development of procedures, methods, and theorems that allow us to extract meaning and information from data that has been generated by stochastic (random) processes.”
“Overfitting is the term used to mean that you used a dataset to estimate the parameters of your model, but your model isn’t that good at capturing reality beyond your sampled data.”
“Data science is the civil engineering of data. Its acolytes possess a practical knowledge of tools and materials, coupled with a theoretical understanding of what’s possible.”
“There are important reasons anyone working with data should do EDA. Namely, to gain intuition about the data; to make comparisons between distributions; for sanity checking (making sure the data is on the scale you expect, in the format you thought it should be); to find out where data is missing or if there are outliers; and to summarize the data.”
“Once we datafy things, we can transform their purpose and turn the information into new forms of value.”
Presentations
Resonate: Present Visual Stories that Transform Audiences“there must be some kind of conflict or imbalance perceived by the audience that your presentation resolves.”
“Creating desire in the audience and then showing how your ideas fill that desire moves people to adopt your perspective. This is the heart of a story.”
“You must show how your idea contrasts with existing expectations, beliefs, feelings, or attitudes if you want to gain the audience’s rapt attention.”
“Identify opportunities for contrast and then create fascination and passion around these contrasts.”
“You are not the hero who will save the audience; the audience is your hero.”
HBR Guide to Persuasive Presentations (HBR Guide Series)“Before you begin writing your presentation, map out that transformation—where your audience is starting, and where you want people to end up.”
“The people in your audience came to see what you can do for them, not what they must do for you. So look at the audience as the “hero” of your idea—and yourself as the mentor who helps people see themselves in that role so they’ll want to get behind your idea and propel it forward.”
“People don’t fall asleep during conversations, but they often do during presentations—and that’s because many presentations don’t feel conversational.”
“Pick the one type of person in the room with the most influence, and write your presentation as if just to that subgroup.”
“Give the hero a special gift: Give people insights that will improve their lives.”
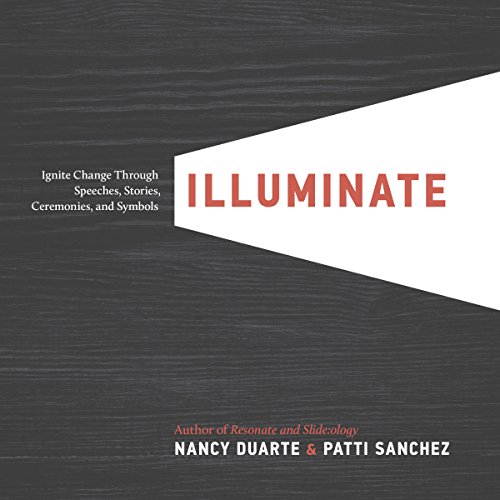
Illuminate: Ignite Change Through Speeches, Stories, Ceremonies, and Symbols“five stages that every venture contains: Dream, Leap, Fight, Climb, and Arrive.”
“Controlling, framing, and conveying the narrative of your venture is the torchbearer’s primary role. To motivate travelers, you’ll need a torchbearer’s communication toolkit: You will deliver speeches, tell stories, hold ceremonies, and use symbols to ease transitions and keep up spirits.”
“They are the ones who can make your dream a reality, but only if it becomes their dream, too.”
“A healthy organization should be in constant motion, always embracing and adapting to a new future.”
“Smart leaders who shoot from the hip instead of planning their communications for an important meeting can end up wreaking havoc because they didn’t consider how others would react to their words.”
Ideas for new books
There are two clusters on this graph, separated by a chasm:
Top Left [ ... chasm ... ] Bottom right
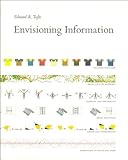
In the top left corner we have books about programming and data science. Bottom right is taken by classic works of Edward R. Tufte
+
=
?
These books are clearly from two different areas - no wonder there is no short path between them. However, I often wonder - what would be a programmers oriented book, that takes main principles of Envisioning Information and translates them into a modern programming language (JavaScript/Python)?
Or, maybe a book about how to explain complex software projects by visual means? Oh I would love that book! Can you write a book like this? Please?
Thanks!
Thank you very much for joining me on this journey today! I hope you have enjoyed it. Please
explore the graph yourself and
let me know what discoveries you'll make. Good luck!